From No Dev Server to GitOps: My Journey of Introducing Kubernetes from Scratch
Hello.
I’m Jeong Jeong-il, a 3rd-year backend developer working at a PropTech platform.
Today, I’d like to share the process of migrating our MSA services, which were running on a legacy Docker environment, to a Kubernetes-based infrastructure, a journey I proposed and built from scratch.
The biggest change was removing Spring Cloud’s Eureka and API Gateway, which we were long accustomed to, and introducing GKE (Google Kubernetes Engine) and ArgoCD.
I’ve organized why I chose this new path over familiar technologies, and how I solved the practical challenges of starting from scratch.
Problems with the Existing Architecture
When I joined the team in March, our company’s existing MSA architecture was running each service as Docker containers using docker-compose or shell scripts. It was a structure that worked fairly well initially. However, as services gradually increased and became more complex, we experienced inevitable ‘growing pains’.
Two major problems troubled us.
1. Limitations of Single Instance
At the time I joined the company, we were operating all containers on a single large instance. This was an advantageous choice from a cost perspective as the company had limited funding.
However, we were in the process of transitioning from legacy monolith to MSA, and as a result, services were increasing from 5, 10, to 15… Problems began to appear due to this.
| |
As services increased, when memory became insufficient, a serious situation began to occur where some services experienced OOM Kill.
CPU was the same. When a specific service monopolized CPU, other services’ response speed slowed, causing a ’noisy neighbor’ problem.
Scaling up to a larger instance? That also had limits, and above all, the fundamental problem of Single Point of Failure (SPOF) was not resolved.
Also, one of the big advantages of MSA is high availability, and I felt that deployment in an environment with such a single point of failure significantly diminishes the meaning of MSA architecture.
Unstable user experience due to an unreliable system leads to service abandonment.
2. Absence of Development Environment
Another point I really wanted to improve after joining the team was the absence of a development server. All testing was done locally, or… (terrifyingly) carefully deployed and tested in the production environment.
"I need to test this..."
"If I run the entire MSA locally, my laptop will explode..."
"Then... carefully in production...?"
These conversations were daily.
Experiencing these problems, we came to the conclusion that “we can’t continue like this anymore,” and to firmly establish scalability, high availability, and a proper development environment, which are directly connected to business continuity, I proposed introducing Kubernetes, the standard for container orchestration, and decided to introduce it after discussions with team members.
3. How I Ended Up Leading This
Actually, I’m not a professional DevOps engineer. However, I was lucky (?) enough to have the opportunity to dig deep into infrastructure in my previous job.
At my previous company, the only infrastructure manager was leaving, and a replacement hadn’t been found, risking a gap in operations. I went to the manager and asked him:
“If something happens to the server while you’re gone, someone has to fix it… If you don’t mind, could you teach me just a little? I’ll try to hold the fort somehow with my limited knowledge.”
Perhaps he appreciated my sincerity, as he gave me intensive mentoring for a month. Thanks to him, I was able to quickly learn AWS EKS, Jenkins, ArgoCD, ELK, and more. After that, I managed the infrastructure alone for about 7 months.
Actually, since it wasn’t an amount I could master in just one month of mentoring, I remember writing down every infrastructure keyword he threw at me in a notebook and looking them up one by one to study… haha..
Looking back now, it was a really reckless challenge… but thanks to that, I learned so much, and I think it was a huge stroke of luck in my life. Before that, like in many companies, I didn’t even have access permissions to the infrastructure.
The situation in my new team was similar. There was no dedicated DevOps engineer, and backend developers were handling infrastructure operations on the side.
Since I was the only one in the team with practical Kubernetes experience, naturally (?), I, a 3rd-year developer, ended up leading this migration project.
Decision-Making Moments
Once we decided to introduce Kubernetes, we faced two major crossroads.
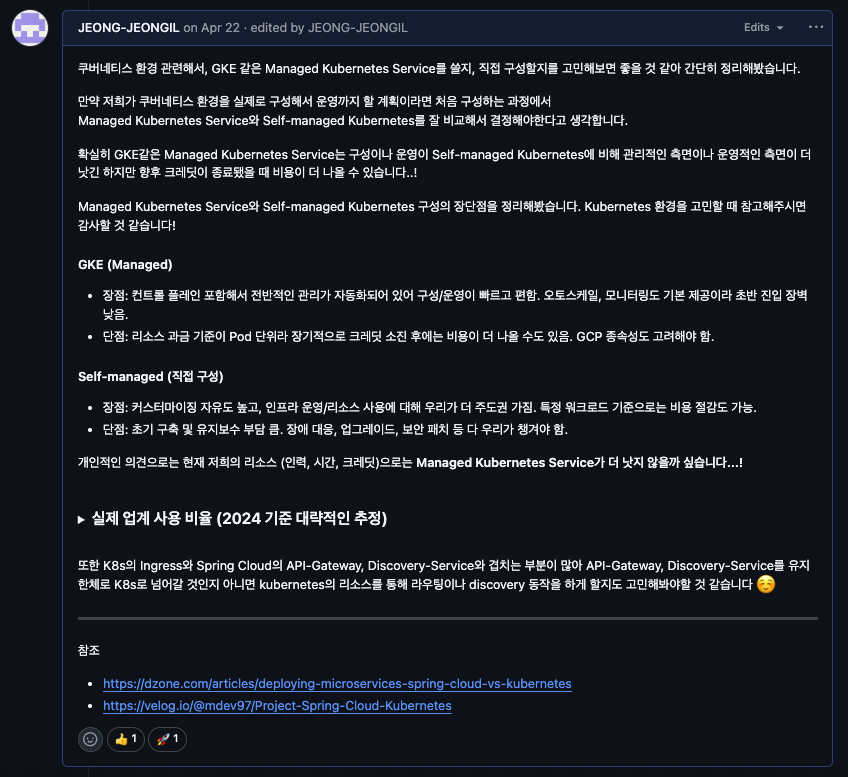
1. Managed vs Self-managed
The first choice was “Should we use a managed service like GKE, or build our own cluster (Self-managed)?”.
This is probably a process all teams considering Kubernetes adoption go through. Our team also put our heads together and weighed the pros and cons of each approach.
| Category | Managed Kubernetes | Self-managed Kubernetes |
|---|---|---|
| Pros | - Quick setup and easy operation: GCP manages everything related to the control plane, which is really convenient - Stability and basic features: Auto-scaling, monitoring, etc. are provided out of the box - Low entry barrier: Can start quickly even without being a K8s expert | - High degree of freedom: Can manipulate infrastructure as desired - Cost optimization possibility: Can save costs if used well - Not tied to a specific cloud |
| Cons | - Cost: May cost more in the long run once credits run out - Cloud dependency: Dependent on cloud | - High initial/maintenance cost: Setup, upgrades, incident response… all our responsibility - Difficult learning curve: Really need an expert who knows well |
Related article says that 73% of all K8s users use managed services. This means most teams value speed and stability.
Ultimately, considering our team’s current manpower and time, Managed Kubernetes, which has low initial setup and operational burden and guaranteed stability, was a realistic choice. We decided to first gain sufficient Kubernetes operation experience with GKE, and if it becomes really necessary later, it’s not too late to move to Self-managed.
2. The Decision to Abandon Spring Cloud
The second choice was “Should we continue with Spring Cloud’s Eureka and API Gateway?”. We thought it was an opportunity to not just migrate infrastructure, but break free from dependency on a specific framework.
Of course, there’s a good project called Spring Cloud Kubernetes, which could allow us to integrate with Kubernetes while using existing code almost as-is. However, we thought this approach would still tie our architecture to Spring, and furthermore to the JVM ecosystem.
At our company, the importance of services written in other languages like Python, such as utilizing AI models, was growing. To integrate and expand services with various technology stacks without any problems in the future, we needed a Language-Agnostic architecture that is not tied to a specific language.
So we made a bold decision:
- Break Free from Framework Dependency: Remove Spring Cloud dependencies. Allow services written in any language to be treated equally within Kubernetes
- Utilize Kubernetes Native Features: Eureka’s role can be sufficiently handled by
K8s DNS + Service, and API Gateway’s role byIngress. Simplify technology stack and eliminate redundancy. - Ensure Future Scalability: Whether a Python-based AI service comes later or any new service is created, integrate smoothly in a Kubernetes standard way.
Ultimately, we decided to remove Eureka and API Gateway and use Kubernetes’s Service and Ingress.
Architecture Transition Work
Initially, I thought the process of removing Eureka and API Gateway and introducing Service and Ingress could proceed relatively smoothly. However, there were parts where code had to be changed because the endpoints where services look at each other through Eureka had to be modified.
A. Code-Level Changes
Integration into Multi-Module
Previously, each MSA service was managed in separate repositories.
# Existing repository structure
- user-service/
- order-service/
- payment-service/
- notification-service/
- agent-service/
... (over 10 individual repositories)
To change a single Feign Client URL, you had to visit all 16 repositories one by one, modify, commit, and open PRs… The bigger problem was that common code was copied to each project. Also, common monitoring-related configurations had different settings for each project, resulting in heavy management burden.
| |
Since our team manpower wasn’t abundant, we decided to integrate projects into a multi-module format to reduce separately managed resources.
# New multi-module structure
multi-module-backend/
├── common/  # Common module
│   ├── feign-clients/  # Collection of all Feign Clients
│   ├── dto/
│   └── utils/
├── user-service/
├── notification-service/
├── match-service/
└── ...
By introducing the COMMON module and gathering Feign Clients in one place, we could modify dozens of services’ Feign Clients at once.
(The process of transitioning to multi-module will be covered in detail in another post later.)
B. Infrastructure-Level Changes
1. Eureka → K8s Service/DNS
The service discovery role that Eureka Server used to do is now replaced by Kubernetes’s Service and DNS.
| |
Now accessible from anywhere in the cluster with the name user-service-svc. The burden of operating Eureka Server also disappeared.
2. API Gateway → Ingress
Instead of the existing Spring Cloud Gateway, we use Kubernetes Ingress.
| |
Now external traffic is received by Ingress and routed to the appropriate service.
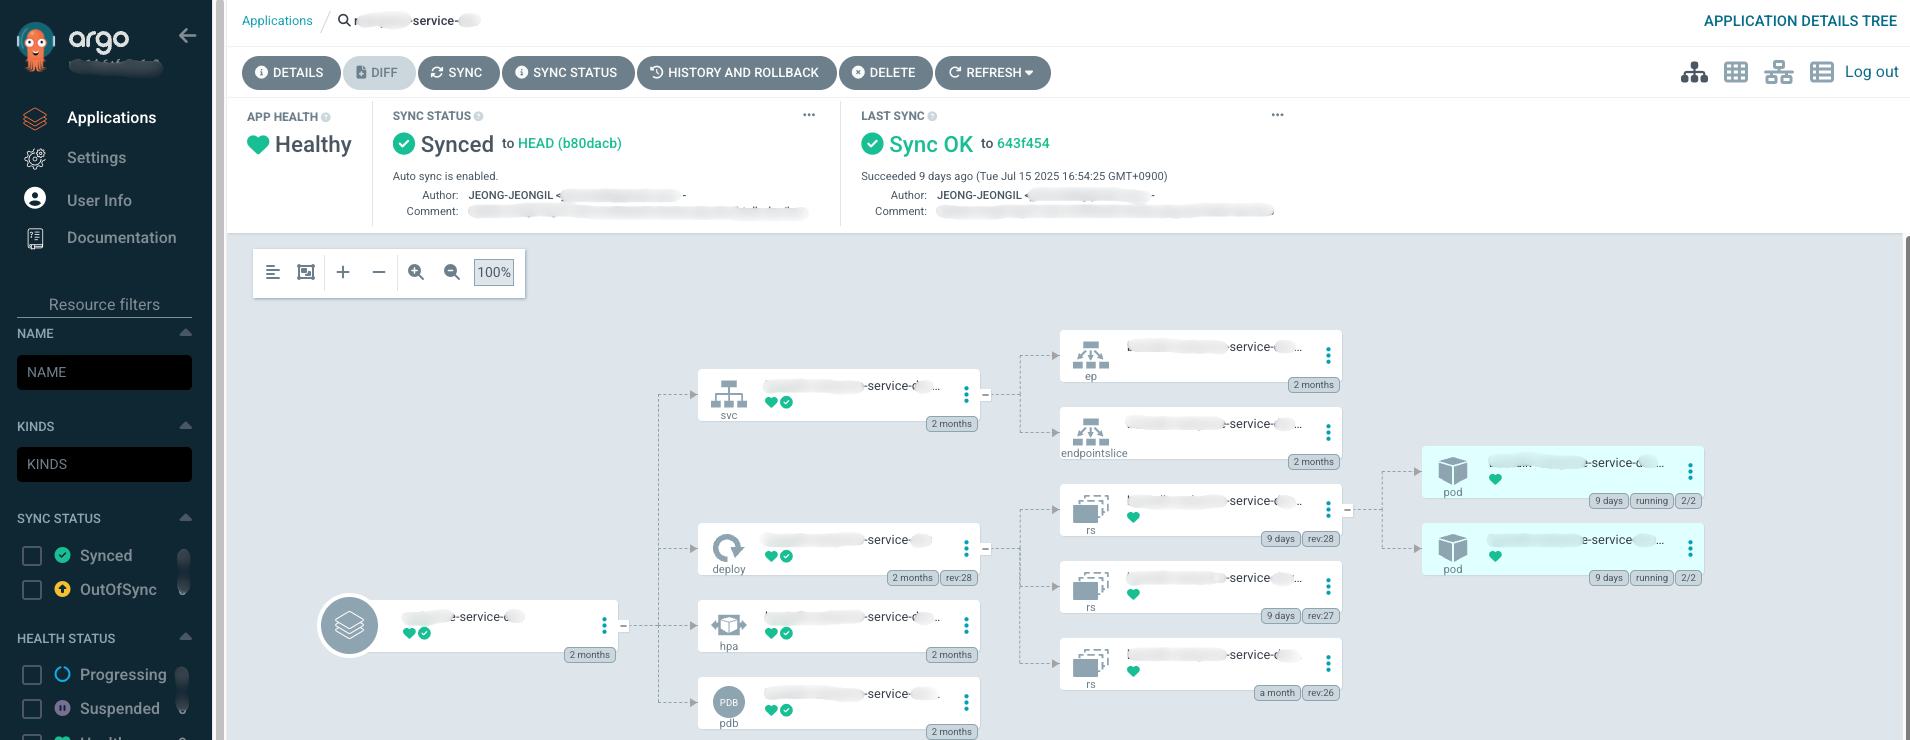
3. GitOps with ArgoCD
Infrastructure configuration and application deployment were completely changed to GitOps approach using ArgoCD. Simply put, manage all infrastructure settings as code in Git repository (manifest-ops).
Our repository structure is roughly like this:
| |
The CI/CD pipeline I built is as follows:
- When a developer modifies code and a PR is merged, it automatically changes only the image tag in
deployment.yaml. (We built this part with Github Actions.) - When the image tag changes, ArgoCD detects “Oh, there’s a change.”
- Development environment configured to Sync automatically
- Production environment configured for developers to manually Sync for stability
- Afterwards, it automatically aligns the cluster state according to what’s defined in Git.
Thanks to this structure, I no longer need to directly type commands like kubectl apply.
Now all change history remains in Git, so you can clearly track who, when, and why changed what, and if there are problems, it’s much easier to revert to a previous version.
C. Observability Improvement
In the Spring Cloud environment, we configured Prometheus to discover services through Eureka and collect metrics. However, with Eureka removed, the monitoring structure also had to be completely redesigned.
1. Prometheus: Shift from Pull to Push
Previously, Prometheus was configured to discover services through Eureka and scrape metrics.
| |
With the transition to Kubernetes, we completely flipped this structure. Push approach through OpenTelemetry.
In the new approach, each service sends metrics to the OpenTelemetry Collector sidecar, and the Collector forwards them to Prometheus.
| |
Now each service actively sends its metrics to the OpenTelemetry Collector (localhost:4317), and the Collector forwards them to the central Prometheus server via Prometheus Remote Write API.
  [Spring Boot App]
      ↓ (OTLP/gRPC)
  [OTel Collector Sidecar]
      ↓ (Prometheus Remote Write)
  [Prometheus Server]
This transition wasn’t easy… We had to recreate all existing Grafana dashboards, and metric names all changed, so we had to rewrite alarm rules too. But as a result, we got a more scalable structure where each service actively sends its own metrics.
2. Integrating Monitoring with Sidecar Pattern
As mentioned earlier, one of our problems was “monitoring configurations differ for each service, resulting in heavy management burden.” To solve this problem, I chose to deploy the OpenTelemetry Collector as a ‘sidecar’ container along with each application Pod. Just hearing about it may not give you a clear picture, so let me show you our configuration example:
| |
The structure can be simply explained as follows:
- The main application container runs the Java Agent through the
JAVA_TOOL_OPTIONSenvironment variable to collect log, trace, and metric data. - The
otel-collectorsidecar container right next to it receives this data on behalf. - The sidecar forwards the collected data to places like Loki, Tempo, Prometheus according to pre-agreed configuration (
otel-collector-config).
Thanks to this structure, we could attach consistent observability functionality to all services without touching a single line of application code. We could manage what were different configurations in one place.
3. Viewing Everything at Once with Grafana
All data gathered at Loki, Tempo, and Prometheus through this centralized pipeline is ultimately integrated and visualized on the Grafana dashboard.
Now our team can grasp the status of all services at a glance with just one Grafana screen, and when a failure occurs, we can quickly analyze the cause by crossing between logs and traces. The biggest gift we got from integrating what were different monitoring configurations into one.
Building Development Environment: Strategic Choice Doubling as Kubernetes Validation
One of the important decisions we made during the Kubernetes introduction process was building the development environment before the production environment.
As mentioned earlier, the need for a development environment was already urgent. But it wasn’t just because we needed a development environment. We needed a sandbox where we could validate the new Kubernetes environment and safely discover and solve problems.
So I approached with the following strategy:
- Build development environment on Kubernetes first - An environment where we can safely experience trial and error without affecting the production environment
- Request cooperation from frontend team - Request web and app teams to call the newly built Kubernetes development server’s endpoint in dev/local environments
- Transition to production after sufficient validation - Migrate production environment only after stability is confirmed in development environment
Thanks to this approach, developers could test safely without blowing up their laptops locally and without “carefully” deploying to production environment.
Of course, this process wasn’t easy at all… There were also cases where settings that weren’t separated by environment variables and were hardcoded, so events published to AWS SQS in the production environment were consumed by the development server 😢 (This incident will be covered in detail later)
Troubleshooting: Painful Moments
1. Development Environment Consuming Production SQS
The most nerve-wracking accident that occurred when first building the development environment can’t be left out.
Previously, since there was no development server at all, all services were looking at only one production environment. But when I looked at the code…
| |
Yes, the SQS URL was hardcoded in the code. Since there was no development environment, naturally, separation by environment wasn’t considered.
What happened after starting the development cluster was exactly as you expected.
“Huh? Why is the statistics data strange in production?”
The development environment was intermittently consuming events from production AWS SQS. 😭 Because of the hardcoded URL, the development environment was also looking at the production queue.
We urgently brought down the development environment and modified the code. We also had to individually publish the events that the development server had consumed 🥲
| |
Lessons learned from this incident:
- Hardcoding is a time bomb
- When adding a development environment to a system that didn’t have a development environment, you must check all external integration points
- How big a debt “let’s just make it work” mindset becomes later…
Now we’ve separated all environment settings from code and thoroughly isolated them by environment. I hope this never happens again…
2. Unexpected Network Issue: Lost External API Integration
One of the confusing moments during Kubernetes transition was when external APIs suddenly stopped working.
It was during testing in the development environment.
Connection timeout...
Connection timeout...
Connection timeout...
An external partner’s API kept failing with timeouts. The strange thing was that it worked normally in the existing instance’s Docker environment.
“Is the configuration wrong? Is it a DNS problem?”
The code was the same, the configuration was the same, but why didn’t it work only in Kubernetes? I think many of you can easily guess the cause.
Cause Identification: Undocumented Firewall Configuration
Suddenly I thought “Is it the firewall?” I carefully contacted the external partner.
“Could you check if you’re managing a firewall for the service we’re using?”
The answer was as expected. The partner had registered our server’s IP on the firewall whitelist.
The problem was that no one on the team knew this fact. Not only me who joined in March, but also existing team members didn’t know. The people who built the legacy system had already left, and there were no documents anywhere. 😢
Solution: Secure Fixed IP with Cloud NAT
Now we knew the cause, but solving it was the problem.
GKE dynamically changes IPs while auto-scaling nodes. It was impossible to fundamentally solve by registering specific node IPs on the firewall.
After deliberation, we decided to introduce Google Cloud NAT.
[GKE Pods] → [Cloud NAT] → [Fixed IP] → [External API]We configured Cloud NAT so that all nodes’ Egress traffic goes out through one fixed IP.
| |
Only after delivering this fixed IP to the partner and registering it on the firewall could we make API calls normally.
Lessons learned from this incident:
- Documentation is not optional but essential - Especially external integration-related settings must be recorded
- Checklist for external dependencies needed during infrastructure transition - Not only DB, cache but also firewalls, VPNs, etc.
- There are hidden landmines in legacy systems - Must validate with sufficient time
So, What Changed?
The transition from Docker-compose to Kubernetes environment brought many positive changes to our team.
- Operation became easier: Deployment automation, auto-scaling, even self-healing functionality that brings services back to life when they die - operational burden really decreased a lot.
- Developers focus only on development: Developers no longer need to worry about infrastructure and can focus only on business logic development. Of course, I still have to worry about Kubernetes infrastructure too haha..
- Simplified Rollback: Since ArgoCD supports Rollback using ReplicaSet, if there’s a problem when deploying a specific version, we can easily perform Rollback that developers had to handle one by one manually in the past. Of course, it’s best not to need Rollback hehe..
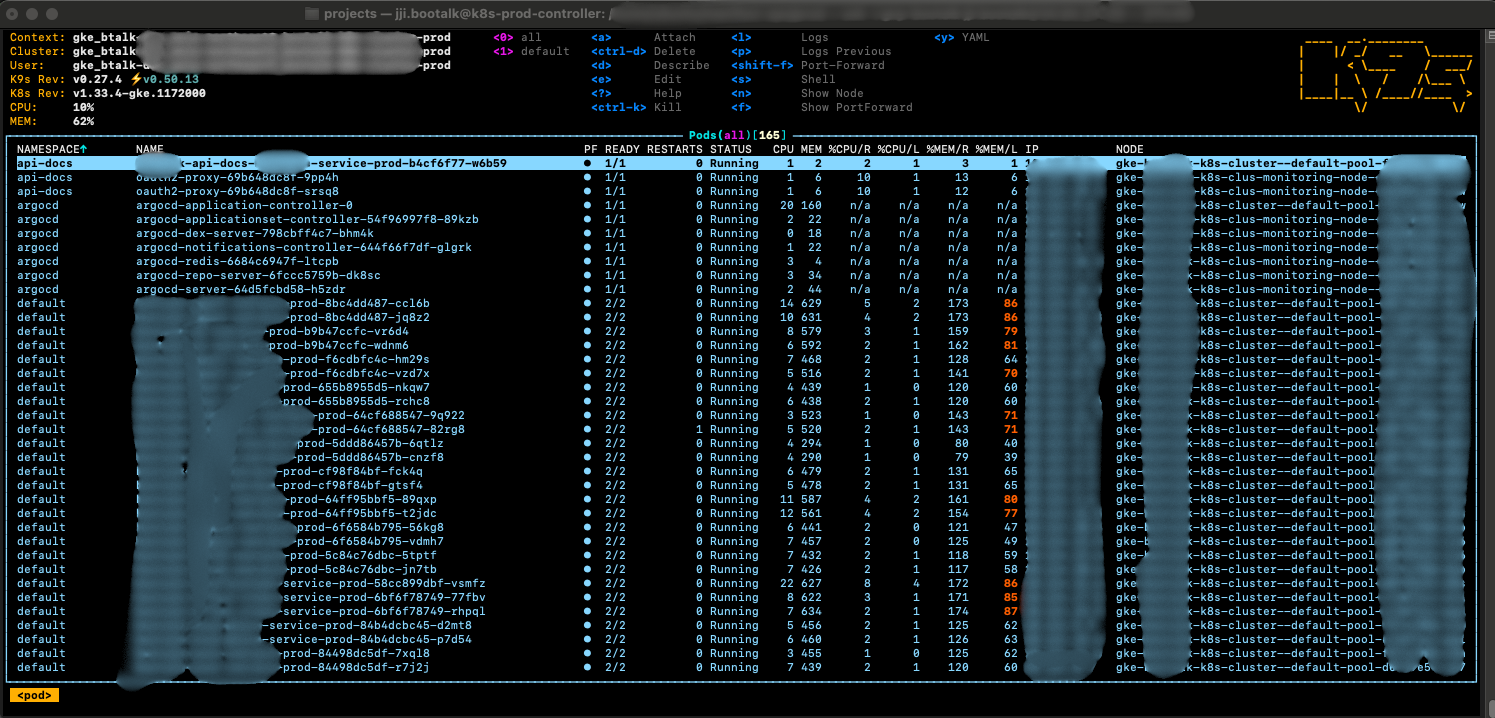
Just looking at the pods running well on the nodes makes me feel proud.. I had configured a Kubernetes cluster before for personal study, but being able to successfully migrate company services to a Kubernetes environment with zero downtime during operation with my own hands gave me tremendous satisfaction 😊
Cost, That Realistic Story
A question well-covered in technical blogs but everyone is curious about, “So how much did it cost?”
To be honest, infrastructure costs increased about 2.5-3 times after the Kubernetes transition.
Reasons for Cost Increase
- GKE Management Cost - Managed Kubernetes control plane cost
- New Development Environment Construction - Addition of complete development cluster that didn’t exist before
- Resources for High Availability - Multiple nodes, load balancer, Cloud NAT, etc.
However, we had secured sufficient credits for 1 year by utilizing the GCP Startup Program.
“Anyway, we have credits we can’t use all in 1 year, let’s build proper infrastructure!”
We could approach with this strategic judgment. When the credits run out, we’re planning the following:
- Clean up unnecessary resources and Right-sizing
- Development environment operates only during business hours (auto-stop at night/weekends)
- Review Spot Instance usage
Why It Was Still Worth It
Looking at cost alone, it increased more than 2 times, but I think what we gained is much more.
- Improved Developer Productivity - Completely different dimension from the days of “carefully deploying to production”
- Reduced Incident Response Time - MTTR (Mean Time To Repair) dramatically decreased with integrated monitoring
- Reduced Operational Burden - Automation reduced overtime and weekend responses
- Business Stability - No longer worrying about “entire failure when one service dies”
I think just preventing system instability from causing user trust to decline creates value beyond cost. Because unstable user experience due to an unreliable system leads to service abandonment.
Conclusion
The transition from Docker-compose to Kubernetes was more than just changing technology stacks - it became an opportunity for our team’s development and operations culture to grow to the next level. We could achieve both team-wide productivity and system stability through declarative infrastructure management and GitOps culture.
Of course, I think there’s still a lot to learn, like Kubernetes’s vast learning curve or complex networking. But I think the experience gained through this transition will be a solid asset to face future technical challenges.
I hope this article can be of small help to other developers who have similar concerns. Thank you for reading this long post.