Service Failures Should Be Detected Before Users Report Them - Building Our In-House Monitoring System
Hello.
I’m Jeong Jeongil, a 3rd-year backend developer working at a proptech platform.
After joining the team in March this year, one thing that stood out was that there were areas for improvement in the team’s monitoring system.
Although we were using AWS CloudWatch before, there was an issue that it wasn’t being utilized effectively.
Particularly, even when failures occurred, we could only recognize problems through user inquiries, and as the time from problem occurrence to development team recognition repeatedly took too long, we desperately felt the need for a more effective monitoring system.
In this post, I want to share why I felt a new monitoring system was necessary and how I built it.
Problem Situation: Failures We Could Only Know When Users Told Us
When I joined the team, the service failure detection process was as follows:
Problem occurs → User CS report → Problem recognition → Cause identification → ResolutionThe biggest problem with this process was that we could only recognize problems when users experienced inconvenience and directly informed us through CS. However, users who actually inquire through CS are only a tiny fraction of all problem experiencers.
Although I’ve covered this aspect once in Absence of Naming Conventions Leads to Failures, I’ll mention it again because it’s a part I consider extremely important.
What do you do when you’re using an app and a strange message appears and the feature you want doesn’t work? Do you often contact customer service to explain? Or do you more often say “Damn!!” and close the app?
Unless it’s a really necessary function or you’re not too angry, most users will probably just close the app. Even if users encounter unexpected situations like this, it’s difficult for the company to identify internally without a monitoring system.
This can be a very big problem because it can cause user churn, which is a critical business result.
Here’s the approximate CS inflow probability from users. Please note that these numbers are empirical estimates based on extensive customer behavior research rather than direct statistical data.
| Factor | Explanation | Estimated Inflow Probability | Key Sources & Rationale |
|---|---|---|---|
| User Churn Tendency | Users have very low patience when service performance degrades (loading delays, errors), preferring immediate churn over problem resolution attempts. | Less than 5% | Think with Google: Mobile page loading time increasing from 1 to 3 seconds increases bounce rate by 32%, and from 1 to 5 seconds increases it by 90%. This shows users tend to churn quickly when facing problems. (Find out how you stack up to new industry benchmarks for mobile page speed) |
| Silence of Dissatisfied Customers | Dissatisfied customers have a strong tendency to quietly leave the service rather than complain, and customer service inquiries require additional effort and time. | 5% ~ 10% | Qualtrics: 96% of customers don’t complain when they have a bad experience and simply leave. This suggests that users experiencing failures are more likely to churn rather than inquire with customer service. (Customer Loyalty: What it is and how to build it) |
| Severity and Frequency of Failures | The more critical and repetitive the failure, the more likely users are to contact customer service for problem resolution. | 5% ~ 20% (severe cases) | Indirect estimation: Based on general views of customer service and user experience (UX) experts rather than specific research. Serious financial loss or service unavailability increases the possibility of customer inquiries. |
| Customer Service Accessibility | Complexity of inquiry channels (ARS, long wait times) acts as another barrier to users. Conversely, if quick resolution is possible, inflow can increase. | Less than 1% with low accessibility More than 10% with high accessibility (maximum) | Indirect estimation: Based on statistics and principles in customer experience (CX) and call center management. Customer service response time and channel diversity (chatbots, FAQs, live chat, etc.) directly affect customer satisfaction and inquiry rates. (Related content can be found in customer service reports from Zendesk, Genesys, etc.) |
| User Relationship/Loyalty | If users have high loyalty to the service or perceive it as essential, they may actively work to resolve problems. | 10% ~ 25% (loyal customers) | Indirect estimation: Trends shown in Customer Relationship Management (CRM) and customer loyalty research. Loyal customers show more patience in problem resolution and have a stronger willingness to provide feedback for service improvement. (e.g., Bain & Company’s Net Promoter Score (NPS) related research, etc.) |
As users’ CS inflow is extremely rare compared to user experience, we think we need to detect failures users face without CS inflow.
Limitations and Low Utilization of Existing CloudWatch
Although we were using AWS CloudWatch before, utilization was low due to the following limitations:
- Cost Efficiency Issues: CloudWatch’s cost structure rapidly increases as log volume grows. Therefore, it was burdensome to accumulate sufficiently solid and diverse logs.
- Search Function Limitations: Difficult to perform complex queries or correlation analysis
- Lack of Integrated Observability: Difficult to see logs, metrics, and traces integrally
- Complex Alert System Configuration: Cumbersome to set detailed alert rules
- Customization Restrictions: Lack of flexibility in dashboards or visualization tools
Due to these limitations, CloudWatch was mainly used only for basic log storage and didn’t function properly as an actual monitoring and alert system. To solve these problems, we decided to build a new logging and monitoring system based on open source.
New Monitoring System Architecture
The new monitoring system was configured with the following components:
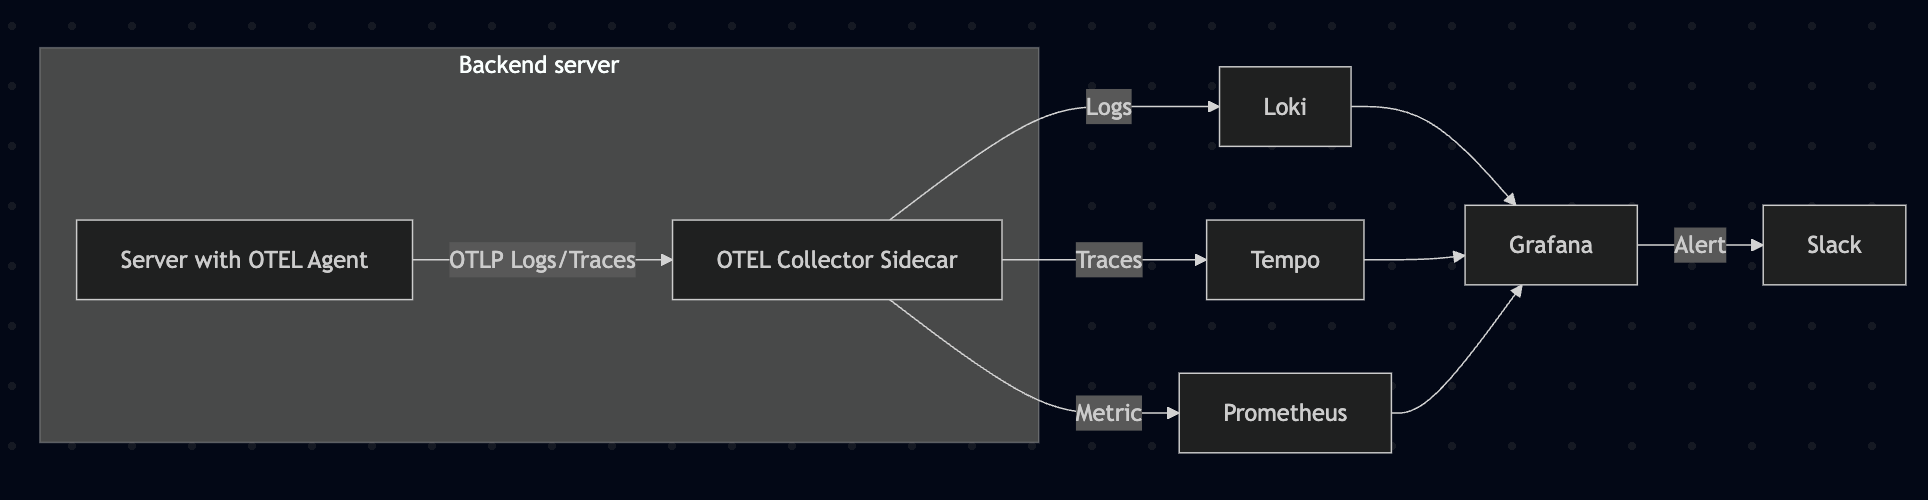
- OpenTelemetry: Application instrumentation and telemetry data collection
- Java Agent: Automatic instrumentation without application code changes
- Collector: Responsible for data collection, processing, and export
- Loki: Log aggregation and storage (replaces ELK Stack’s Elasticsearch + Logstash)
- Prometheus: Metric collection and storage
- Tempo: Distributed tracing (APM)
- Grafana: Integrated dashboard and alert system
During the initial system construction process, we deliberated a lot between ELK Stack and Loki, Grafana, Tempo, Prometheus stack.

We had many team meetings and discussions.
The main reasons for choosing this stack are:
- Cost Efficiency: Loki has different indexing methods and uses fewer resources compared to ELK Stack, making it cost-effective
- Integrated Observability: Can check logs (Loki), metrics (Prometheus), and traces (Tempo) in one place through Grafana
- Scalability: Configured optimized for Kubernetes environment to flexibly respond to service expansion
- Community Support: Active open-source community and abundant references
There are reasons like these, but frankly, the biggest reason for choosing the Loki, Grafana, Tempo, Prometheus stack was cost.
Since it’s lighter compared to ELK Stack, when operating on Cloud, we could measure and operate with lower specs compared to ELK Stack, and because our company wasn’t in a financially comfortable state, we chose the more cost-advantageous stack.
ELK Stack vs Grafana + Loki Cost Comparison Table
| Item | Components | Minimum Specs | Recommended Specs | EC2 Instance Type (Seoul) | Hourly Rate (USD) | Monthly Expected Cost (24h × 30 days) |
|---|---|---|---|---|---|---|
| ELK Stack | Elasticsearch, Logstash, Kibana | 8GB RAM, 2 vCPU | 16GB RAM, 4 vCPU | t3.large / m5.xlarge | $0.129 / $0.279 | $92.88 / $200.88 |
| Grafana + Loki | Grafana, Loki | 1GB RAM, 1~2 vCPU | 2~4GB RAM, 2 vCPU | t3.micro / t3.medium | $0.017 / $0.052 | $12.24 / $37.44 |
In fact, I had experience operating the Loki, Promtail, Grafana stack smoothly even on a t3a.small instance in a previous side project.
Applying OpenTelemetry: Stepwise Evolution
Building the monitoring system wasn’t completed at once, but was a process of gradual improvement.
Stage 1: Direct OpenTelemetry Endpoint Configuration in Each Service
Initially, to apply quickly in the existing EC2 environment, I started by directly configuring the OpenTelemetry Collector endpoint in each service.
Advantages:
- Quick application: Can be applied with just configuration without changing existing infrastructure
- Simple structure: Just configure endpoints without separate complex settings
Disadvantages:
- Increased management points: Individual configuration needed for each service
- Difficult to maintain consistency: Configuration can differ for each service
- Cumbersome updates: Need to modify all services individually when OpenTelemetry configuration changes
Actual application example (application.yml):
| |
We added OpenTelemetry Java Agent to each service’s dependencies:
| |
By operating this way for about 2 months, we could confirm the effectiveness of the monitoring system. However, as services increased, management difficulties also grew.
If we needed to upgrade the otel version or change common settings, we had to apply them directly to all services one by one.
Stage 2: Transition to Sidecar Pattern with Kubernetes Introduction
From June, as we gradually migrated to the Kubernetes environment, we implemented OpenTelemetry Collector using the sidecar pattern.
Advantages of Sidecar Pattern:
- Minimize application code changes: Can collect telemetry data without major service code modifications
- Consistent data collection: Can be applied uniformly to all services
- Independent updates: Can update application and monitoring system independently
- Central management: Manage settings centrally with ConfigMap
The actual implementation proceeded as follows:
- Apply OpenTelemetry Java Agent: Download Agent via Init Container
- Configure sidecar container: Add OpenTelemetry Collector sidecar container to each service Pod
- Pipeline configuration: Set to send log, metric, and trace data to Loki, Prometheus, and Tempo respectively
Below is part of the actual event service deployment configuration.
| |
OpenTelemetry Collector configuration is centrally managed via ConfigMap:
| |
Comparison of Both Methods
| Category | Direct Endpoint Configuration | Sidecar Pattern |
|---|---|---|
| Application Environment | EC2, VM | Kubernetes |
| Configuration Location | Inside each service | ConfigMap (central management) |
| Management Complexity | High (individual management) | Low (central management) |
| Consistency | Difficult to guarantee | Guaranteed |
| Update | Need redeployment of each service | Only modify ConfigMap |
| Resource Usage | Slightly less | Slightly more (sidecar overhead) |
| Application Speed | Fast | Relatively slow (needs K8s) |
System Introduction Effect: Change in Failure Detection Process
After introducing the new monitoring system, the failure detection process changed as follows:
Problem occurs → Alert received → Problem recognition → Cause identification → ResolutionNow the development team can recognize and respond to problems before users inquire through CS. Particularly, there were the following effects:
- Shortened failure detection time: Average detection time shortened from several hours to several minutes
- Proactive response possible: Can solve problems before user impact grows
- Accurate cause identification: Can accurately identify causes by analyzing logs, metrics, and traces integratively
- Prevent repetitive problems: Possible to take preventive measures through pattern analysis
Actual Case: Effectiveness of Monitoring System
After building the monitoring system, we could discover and solve several problems we couldn’t find before. Among them, a representative case was an exception that occurred in the ‘monthly rent’ search function.
This problem was due to naming convention inconsistency, where Service A defined monthly rent as ‘monthly’, while Service B and its connected database defined it as ‘rent’. The problem didn’t stop at simple naming inconsistency. Among the database procedure parameters, the ’transaction type’ field had limited string length (VARCHAR(5)), and ‘monthly’ (7 characters) exceeded this limit, causing exceptions. (Related article about this case - Absence of Naming Conventions Leads to Failures.)

Since this was a low-frequency feature, it wasn’t discovered for a long time. In the existing system, we could only know about this problem if users inquired through CS, but thanks to the new monitoring system, we could detect it in real-time and solve it quickly without user reports.
Like this, the monitoring system allowed us to discover and solve problems before users experienced inconvenience, or problems that users experienced but didn’t inquire about through CS, which the development team couldn’t recognize.
Alert System Configuration
Using Grafana’s alert function, we configured the following alert rules:
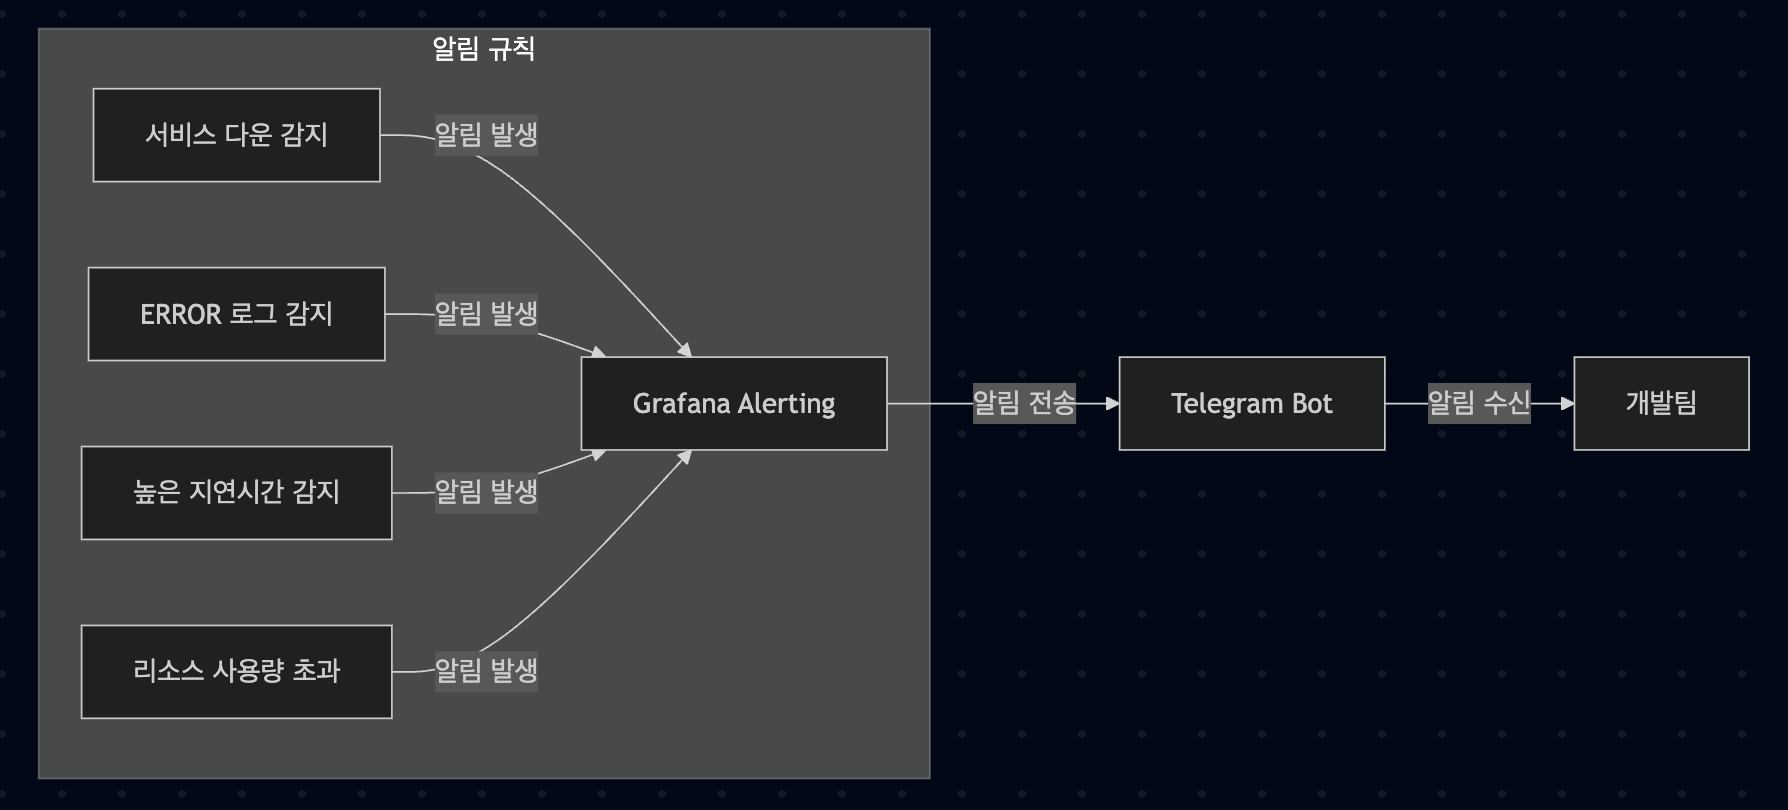
- Service down alert: Send alert if even one instance goes down
- Error log alert: Send alert when ERROR level log occurs
- High latency alert: Send alert when API response time exceeds threshold
- Resource usage alert: Send alert when CPU, memory usage exceeds threshold
Alerts are sent in real-time via Telegram, and each alert includes a Runbook link for problem resolution, enabling quick response.
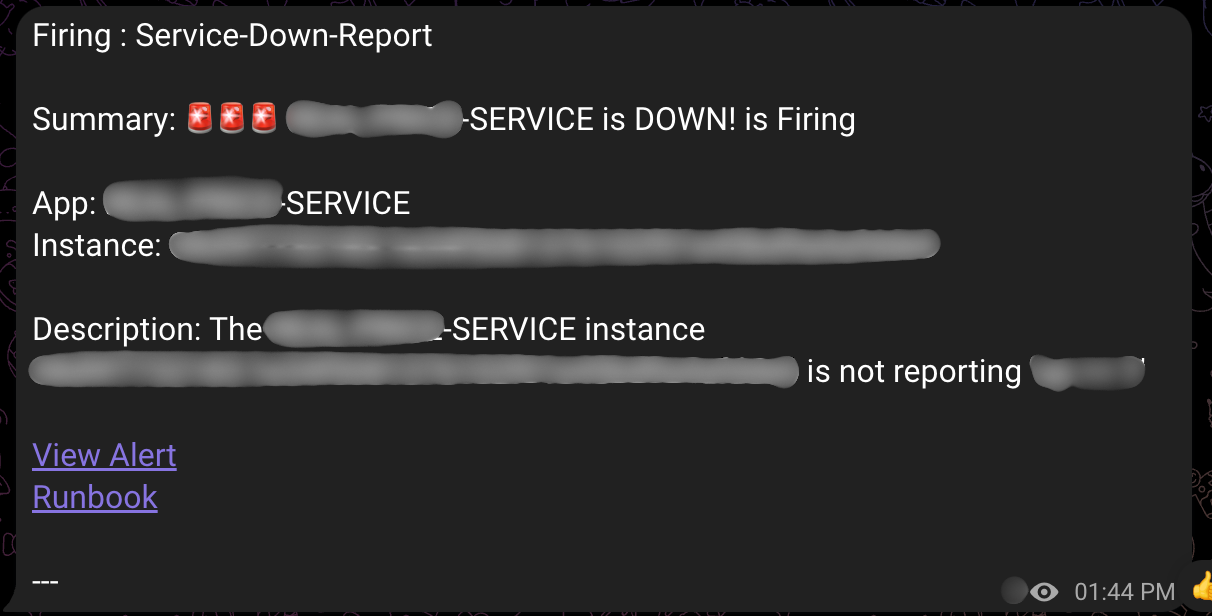
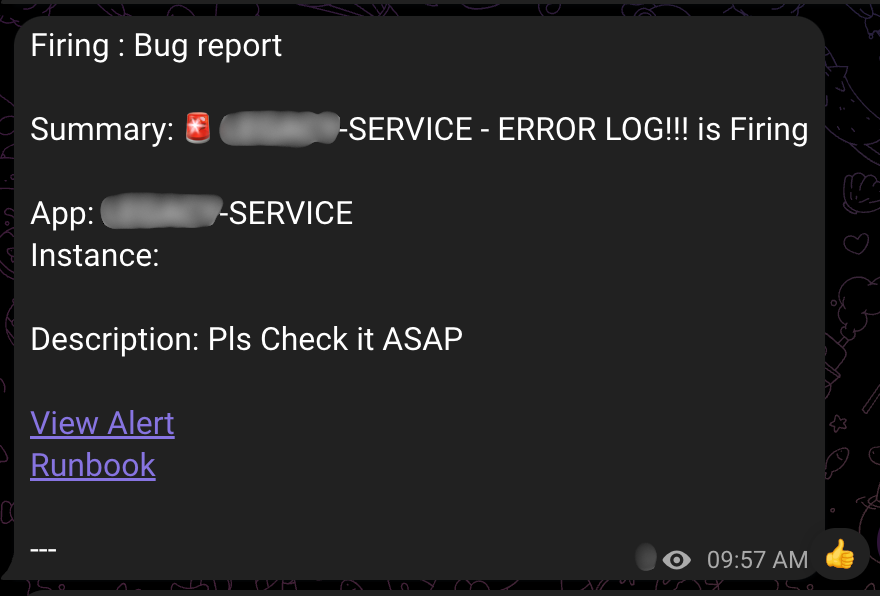
The above images are examples of alerts generated in the actual operating system. Alert messages include the following information:
- Alert type: ‘Firing’ (problem occurred) or ‘Resolved’ (problem resolved)
- Alert name: ‘Service Down Report’ (service down) or ‘Bug Report’ (error log)
- Service information: Indicates which service had the problem
- Runbook link: Guide for problem resolution and problem exploration link
Thanks to this detailed information, the development team can quickly grasp problem situations and respond appropriately.
Performance Improvement Through Trace and APM
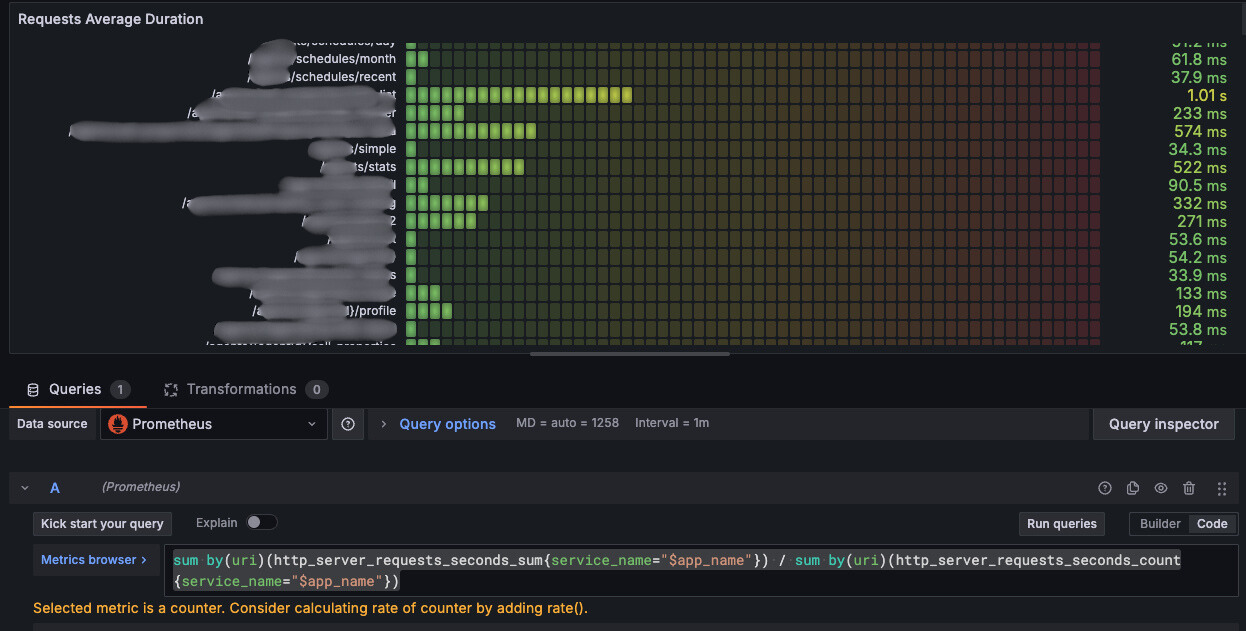
First identify APIs needing improvement by analyzing Prometheus metrics
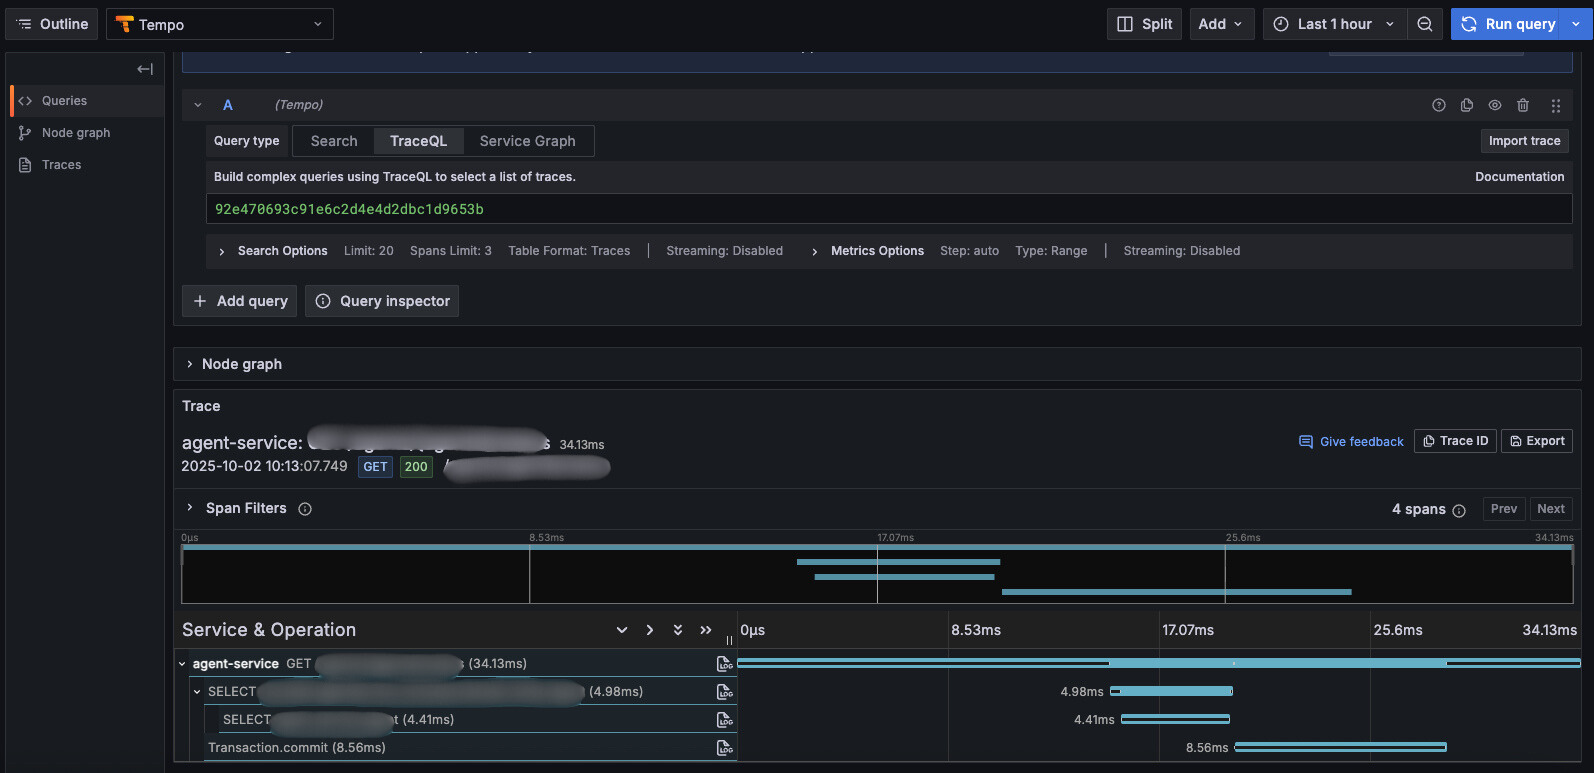
Since we can identify bottlenecks per request through Tempo, an APM, we can quickly identify parts needing response speed improvement.
Reflection: Importance of Gradual Improvement
Looking back at building the monitoring system, not trying to create a perfect system at once seems to have been the key to success.
Stage 1 (April): Start with a quickly applicable method
- Configure endpoints directly in each service
- Quickly confirm effectiveness
- Identify problems
Stage 2 (June~): Transition to improved architecture
- Apply sidecar pattern with Kubernetes introduction
- Improve operational efficiency with central management
- Secure scalability
If we had tried to create a “perfect” Kubernetes + sidecar structure from the beginning, it would have taken much longer and we would have missed more failures in the meantime.
I learned the lesson: “Start quickly and improve gradually”.
Conclusion
Through building the monitoring system, our team could significantly improve service stability and user experience. Particularly, I think the biggest achievement is detecting and solving problems before users experience inconvenience and inquire, lowering the possibility of the critical problem of user churn.
I think the monitoring system is not just a technical tool, but important infrastructure that improves service quality and user experience. I think integrated observability is especially more important in microservice architecture.
I hope this has been somewhat helpful to those who don’t have monitoring and exception alert systems configured or were looking for related content, and I’ll conclude this post here. Thank you!